×

We've got news for you.

Register on SowetanLIVE at no cost to receive newsletters, read exclusive articles & more.
Register now

SA's new 'R number' shows the lockdown worked, say scientists

Every South African with Covid-19 is passing on the virus on to an estimated 1.5 people.
Image: 123rf/lightwise

The latest Covid-19 “R number” is hovering around 1.5, the National Institute of Communicable Diseases (NICD) said on Friday.

This means every infected person is passing on the virus to around 1.5 people, so the number of new cases is increasing.

In the four provinces where there are enough cases to calculate an R number, the Western Cape's is the highest, on average.

The NICD analysis, which comes with several caveats, says the five weeks of level 5 lockdown which began on March 26 “substantially reduced the national R, likely contributing to substantially slowing the progression of the epidemic”.

But the fact that R remained above 1 meant transmission of Covid-19 was continuing, and “further easing of lockdown restrictions may be associated with increases in R in different provinces as contacts between people increase”.

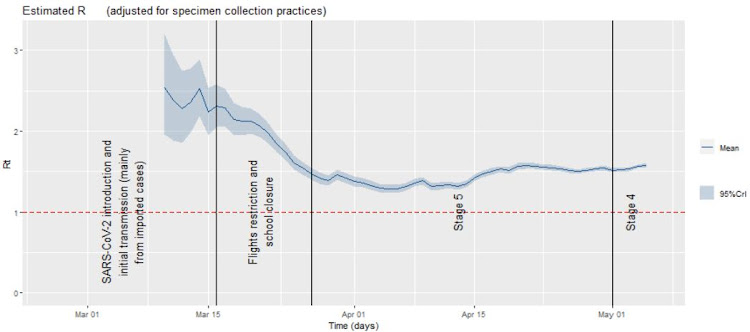
The NICD estimate of SA's R number.
Image: NICD

The NICD report covers the period from SA's first confirmed infection on March 5 to May 19. The final date, however, allowed 14 days for testing delays and development of symptoms, meaning it takes account of infections that happened up to May 5.

The NICD estimate of Gauteng's R number.
Image: NICD

SA's initial R, calculated on March 24 and based mainly on transmission of Covid-19 from international travellers arriving in SA, was estimated between 1.7 and 2.5.

The NICD estimate of the Western Cape's R number.
Image: NICD

The NICD said changes in the rate of reporting Covid-19 cases and definitions for testing would affect estimates of R.

The NICD estimate of the Eastern Cape's R number.
Image: NICD

“While we attempted to adjust for changes in testing practice, residual bias may remain,” they said.

The NICD estimate of KawZulu-Natal's R number.
Image: NICD

“Therefore, it is important to interpret these findings together with data on testing and other sources of data on transmission.

“In addition, caution should be exercised in interpreting comparisons between different time points and provinces as these could be affected by different testing practices.”